August 15, 2026 · 5 min read
I thought logs were observability
A service kept restarting and I had every log line it ever wrote. I still had to SSH to a box to find out why. That is the gap between storing output and being able to see a system.

It was festival sale night, and a service in a customer’s cluster would not stay running. It started, ran for a minute or two, exited, and something started it again, while the homepage was still taking taps.
I had the logs. I had all of them, shipped off the machines and searchable. I found the line within a minute: the service exiting, over and over. And then I sat there, unable to say the one thing anyone actually wanted to know: was this one machine having a bad night, or the whole sale coming apart.
Why the logs could not tell me
I ended up SSHing onto a box and running df. The disk was full. One node. That was the whole incident: a full disk on a single machine, a service that could not write, and a supervisor restarting it forever.
The logs had not been wrong. They said a process exited, which it had. What they could not do was any of the things I needed. They could not tell me the exits were coming from one host rather than twenty, because nothing on the line said which host it was. They could not tell me the rate was steady rather than climbing, because a line is a single moment. And they could not connect the exits to a disk filling up, because those are two different subsystems and nobody had written a line that mentioned both.
Every one of those is a question somebody would have had to anticipate months earlier and write a print statement for. That is what a log is: a sentence a process was told to say, chosen in advance by a person guessing at which incident was coming.
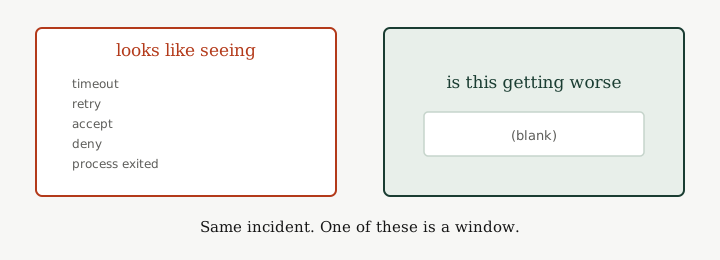
That guess is usually good, because most incidents rhyme with an earlier one. The guess fails the first time something breaks in a shape nobody had in mind, which is exactly when you need help most.
Why logs feel like seeing
Logs are made of words, and that is the trick they play.
A timeout gets a sentence. A retry gets a sentence. Spend enough years reading them and the reading starts to feel like seeing. I could look at a wall of accept, deny, and timeout and narrate what the box was doing.
What I actually had was fluency in one machine’s diary. It reads well. It does not aggregate. It has no sense of time beyond one line at a time.
The shape of the job that made it obvious
The work I do now put this in front of me repeatedly.
An agent gets installed on a machine that is not ours, on a customer’s host. It watches two things. First, the software on their side that runs the cluster: which services it believes are up, what it just restarted. Second, the machine underneath: processor, disk, memory, which processes are actually alive. Then a screen has to turn all of that into something a person can act on.
If the agent’s only job were to ship log files, that screen would be a search box, and every incident would go the way mine did. You would still be reading sentences, still unable to say whether one node is sick or all of them.
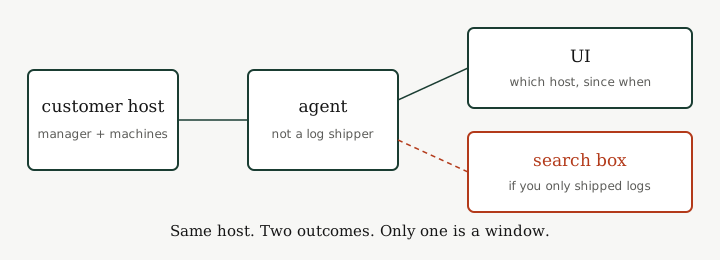
The questions in a real incident are all of this kind. Is this one host or every host. Did this begin recently, or have we been sliding for an hour. Is the box out of disk, or is a service simply restarting in a loop.
Not one of those is a question about a single line. My incident was all of them at once.
Three signals, three jobs
I had been trying to do all of it with one kind of output.
Logs tell you what one process thinks happened, on one occasion. They are the right tool once you already know which process and roughly which minute.
Metrics are counts and measurements over time: how often, how long, how full. They are how you get a shape. A metric for disk usage per host would have shown one node climbing toward full while the others sat flat. The incident would have been about ninety seconds long.
Traces follow a single request across every service it touches. They answer which hop ate the time.
Then there is a fourth thing that is not a signal at all. Context is the labels attached to everything else: host, service, cluster, version. It is what lets you cut a metric by host and see that one line is different. My incident was a context failure as much as anything. The exits were recorded without the name of the machine, so twenty healthy nodes and one dying one looked identical.
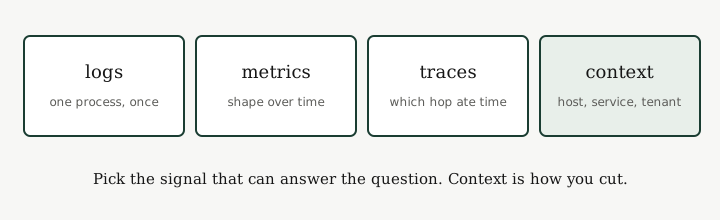
I still want logs. I want them after a metric or a host list has pointed me at a neighbourhood. Opening the raw stream first is walking every street because nobody handed me a map.
Starting from the question
Before typing anything, write down the question. Then pick the signal that can answer it. If none of what you collect can answer it, that is the gap. The fix is a metric or a label, not one more print statement.
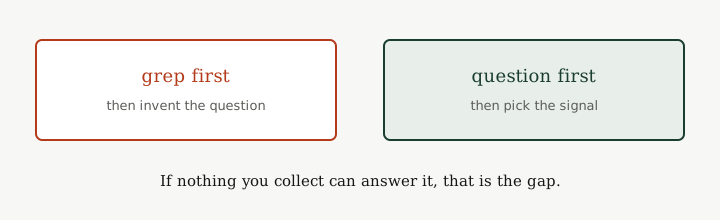
I know I am back in the old model when the first thing I do is search rather than ask, or when I can prove a process died and cannot say whether anything else in the cluster noticed.
For an agent on somebody else’s machine the bar is concrete. Can the screen tell me the manager is up, the workers are up, and one particular disk is why a service will not stay running. If I have to SSH to learn that, the agent did not finish its job.
I still attach a unique label for every user to a metric and teach myself what a large bill looks like. I still treat a good-looking dashboard as understanding.
I am done calling a stack of logs a window.
If this is useful, wrong, or incomplete, write to me.